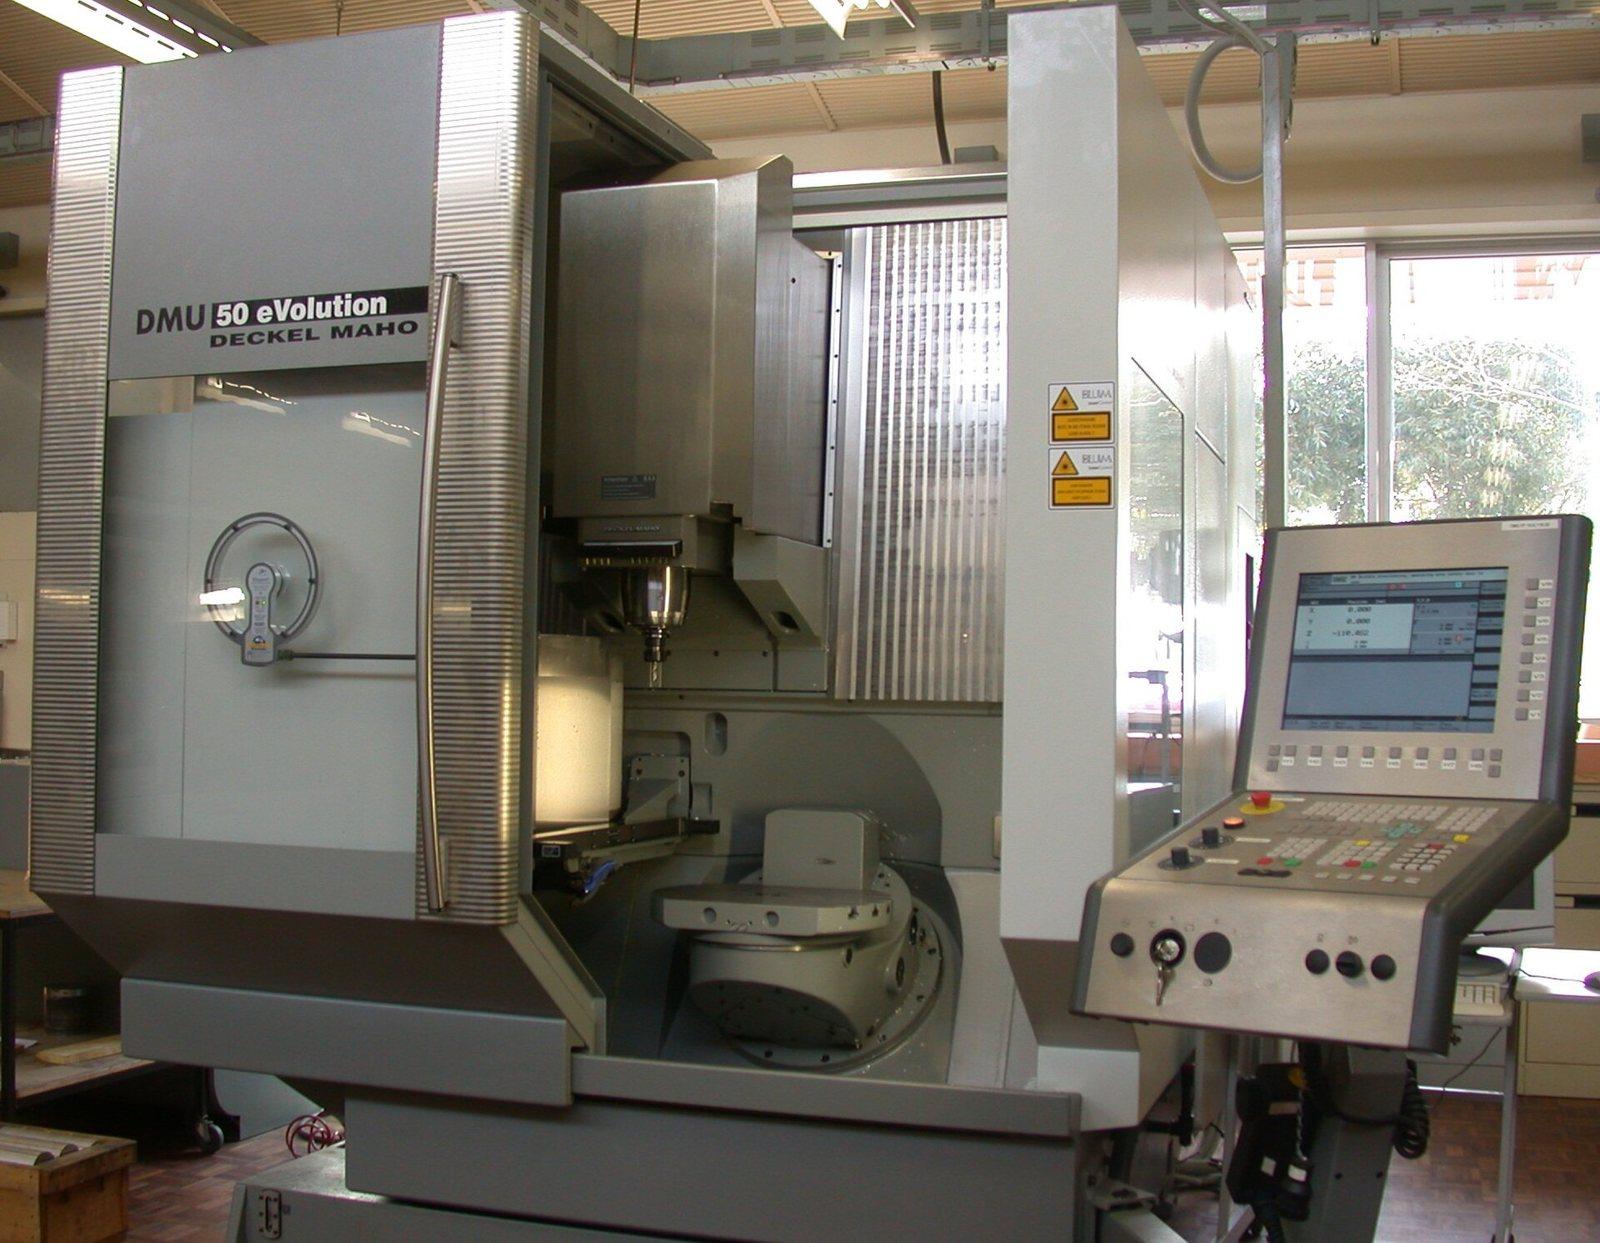
Every shop has one. The 2004 machining centre that still holds tenths, still runs three shifts, and will never, ever get an MTConnect option, because the control predates the standard and the machine builder stopped caring a decade ago. When someone says "let's monitor the whole floor," that machine is where the project quietly dies.
It doesn't have to. MTConnect was designed for exactly this: the agent (the part that serves clean XML over HTTP) doesn't care where the data comes from. It only needs an adapter feeding it simple text lines. If the control can't be the adapter, a $60 Raspberry Pi watching the stack light can. This post walks through the whole chain end to end: signals, adapter, device file, agent config, and how to check it's actually working.
New to the protocol landscape?
If you're still deciding between MTConnect, OPC UA, and FOCAS for your fleet, start with the developer's decision guide. This post assumes you've picked MTConnect and have a machine that can't speak it natively.
The three-part architecture, in one picture
MTConnect splits the job in two on purpose. The adapter knows the machine: it reads signals and writes them out as SHDR (Simple Hierarchical Data Representation), pipe-delimited text lines over a plain TCP socket, by convention on port 7878. The agent knows the standard: it connects to one or more adapters, validates the values against a device model, buffers history, and serves /probe, /current, and /sample over HTTP, by default on port 5000. Clients (dashboards, MES, an MCP server) only ever talk to the agent.
[machine signals] --> [adapter: Pi, SHDR on :7878] --> [agent: HTTP on :5000] --> dashboards, MES, scripts
   stack light,          60 lines of Python           cppagent (open source,
   M-code relay                                        Apache 2.0)
That split is what makes legacy machines tractable. You never touch the agent's code. You write a tiny adapter for whatever signals the old machine does expose, and the agent turns them into the same standards-compliant stream your newest machine produces.
What a legacy machine can actually tell you
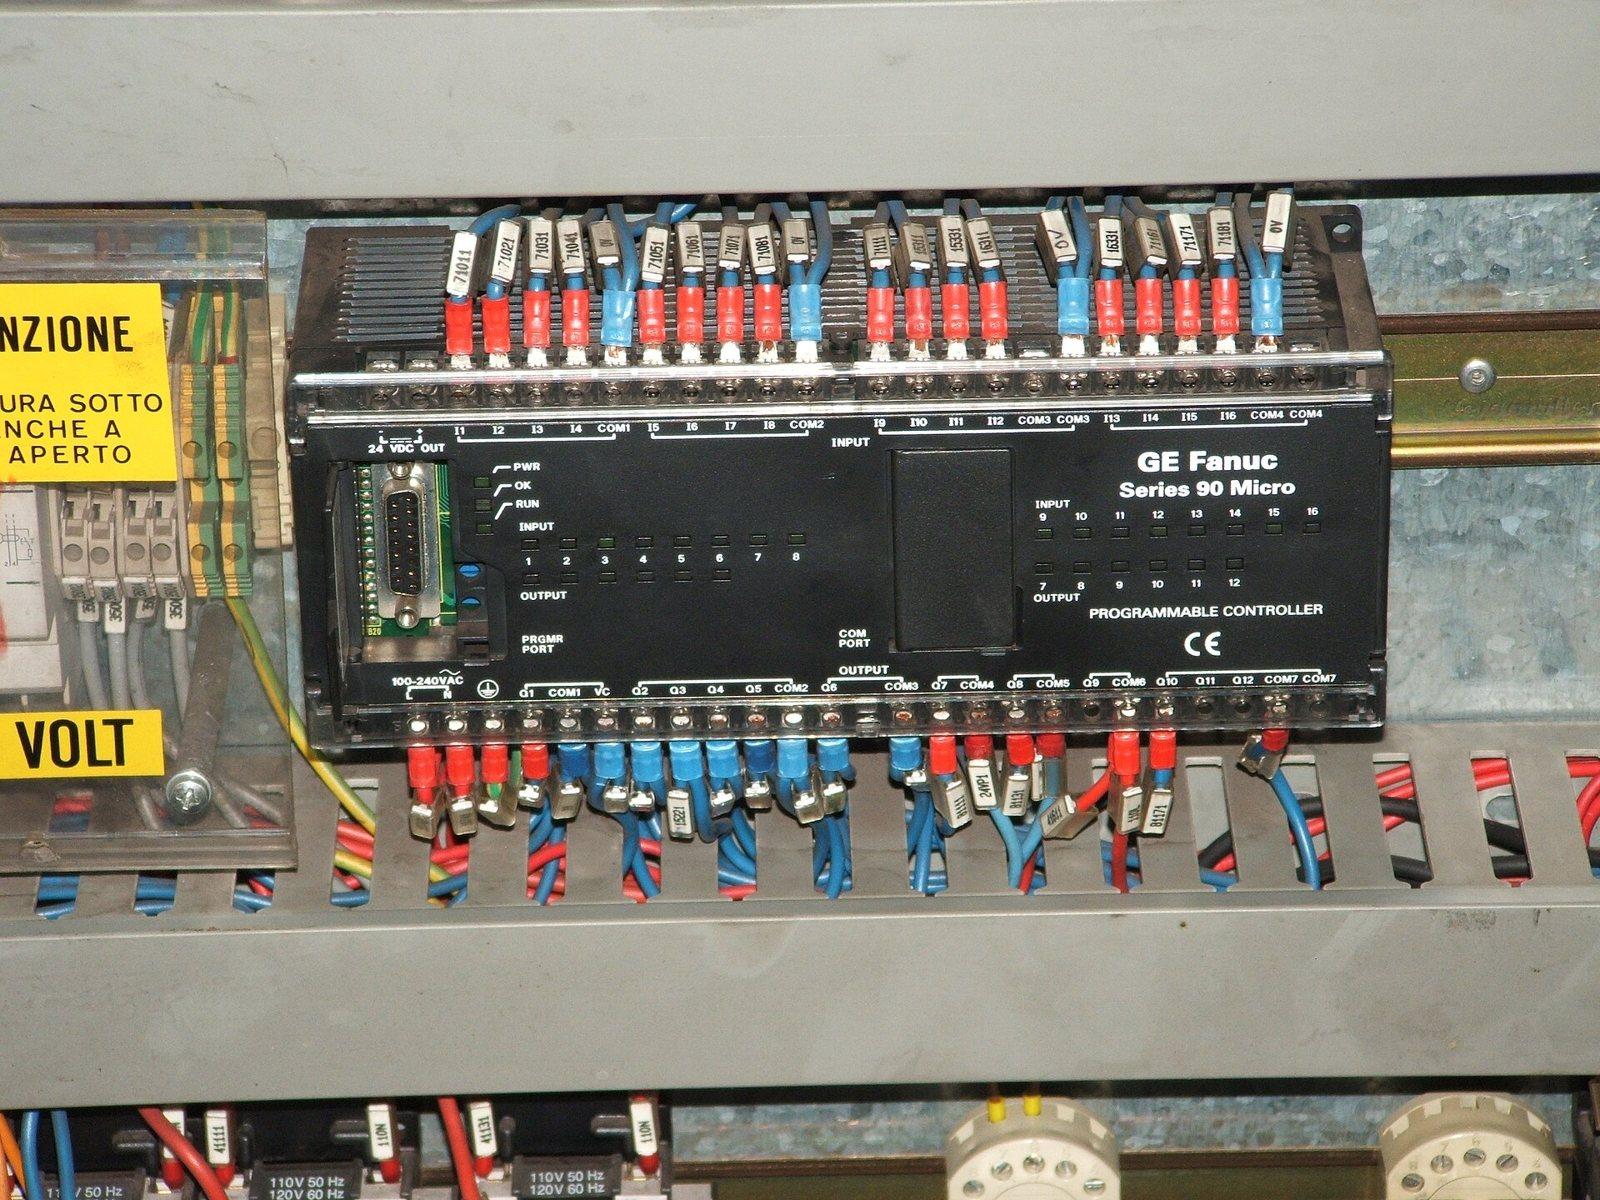
Be honest about the inputs before you promise anyone a dashboard. Without a network-capable control, you're reading physical signals, and each one answers a narrower question than a FOCAS call would:
| Signal | How to tap it | What it tells you | MTConnect data item |
|---|---|---|---|
| Green stack light | 24 V lamp output → opto-isolated input | Program running (cycle in progress) | Execution = ACTIVE |
| Yellow / amber light | 24 V lamp output → opto input | Waiting, feed hold, or M00/M01 (builder-dependent) | Execution = INTERRUPTED or READY |
| Red light | 24 V lamp output → opto input | Alarm present | Condition (SYSTEM) = FAULT |
| Part-count M-code | Spare M-code relay pulsed once per cycle | A part was completed | PartCount |
| Spindle current | Split-core CT clamp on one motor lead | Spindle actually cutting, roughly how hard | Load / sample (advanced) |
| Power | Relay on the control's 24 V supply | Machine powered on | Availability |
Talk to maintenance before you touch the cabinet
You're tapping a 24 V lamp circuit, not rewiring the machine, but it's still inside an electrical cabinet with mains voltage nearby. Use an opto-isolated 24 V input module (never wire 24 V straight to a 3.3 V Pi pin), parallel off the lamp terminals rather than interrupting them, and have a qualified electrician do the install. If the machine is under a service contract, ask the builder first.
The stack light's meaning is set by the machine builder's PLC, not by a standard, so spend ten minutes at the machine with a notepad: what lights during a cycle, during feed hold, at M00, at M30, during an alarm, at power-up. That mapping table is the most important artifact of the whole project, and it's specific to that machine.
Step 1: the adapter (SHDR in 60 lines of Python)
SHDR is deliberately simple. Each line is a timestamp followed by name|value pairs: 2026-09-06T14:03:22.120Z|exec|ACTIVE. Conditions (alarms) have their own line format with extra fields: timestamp|name|level|native_code|native_severity|qualifier|message, and each one must go on its own line. The agent also sends * PING heartbeats; reply with * PONG <ms> or it will assume the adapter is dead and mark everything UNAVAILABLE.
# legacy_adapter.py - stack light -> MTConnect SHDR on port 7878
import socket, threading, time
from datetime import datetime, timezone
from gpiozero import Button   # opto-isolated inputs on GPIO pins

GREEN, AMBER, RED, COUNT = Button(17), Button(27), Button(22), Button(23)
clients, lock, parts = [], threading.Lock(), 0

def ts():
    return datetime.now(timezone.utc).isoformat(timespec="milliseconds").replace("+00:00", "Z")

def state():
    """Map lamp states to MTConnect values - adjust to YOUR machine's mapping table."""
    if GREEN.is_pressed:
        execution = "ACTIVE"
    elif AMBER.is_pressed:
        execution = "INTERRUPTED"
    else:
        execution = "READY"
    return {"avail": "AVAILABLE", "exec": execution, "partcount": str(parts)}

def condition_line():
    if RED.is_pressed:
        return f"{ts()}|system|FAULT|RED_LAMP|||Red stack light on"
    return f"{ts()}|system|NORMAL||||"

def send(line, only=None):
    with lock:
        for c in list(only and [only] or clients):
            try:
                c.sendall((line + "\n").encode())
            except OSError:
                clients.remove(c)

def handle(conn):
    # new agent connection: send a full snapshot first
    send(ts() + "".join(f"|{k}|{v}" for k, v in state().items()), only=conn)
    send(condition_line(), only=conn)
    for raw in conn.makefile():
        if raw.startswith("* PING"):
            send("* PONG 10000", only=conn)

def on_count():
    global parts
    parts += 1

COUNT.when_pressed = on_count

def serve():
    srv = socket.create_server(("0.0.0.0", 7878))
    while True:
        conn, _ = srv.accept()
        with lock:
            clients.append(conn)
        threading.Thread(target=handle, args=(conn,), daemon=True).start()

threading.Thread(target=serve, daemon=True).start()
last, last_cond = None, None
while True:
    cur, cond = state(), condition_line().split("|", 1)[1]
    if cur != last:                       # publish on change only
        send(ts() + "".join(f"|{k}|{v}" for k, v in cur.items() if not last or last[k] != v))
        last = cur
    if cond != last_cond:
        send(condition_line())
        last_cond = cond
    time.sleep(0.1)
Three details matter more than they look. Publish on change: the agent timestamps and buffers every observation, so repeating ACTIVE ten times a second just burns its buffer. Snapshot on connect: when the agent restarts, it needs the current state immediately, not at the next lamp change. And debounce: the 100 ms loop is a crude filter, but some builders flash the amber light, so if yours does, track the last-on time and treat "on within the last 1.5 s" as on.
Step 2: describe the machine (Devices.xml)
The agent needs a device model so it knows which SHDR names map to which standard data items. The name attribute is what your adapter sends; the type is the MTConnect vocabulary that every client understands. Keep it small: only declare what you can actually measure.
<?xml version="1.0" encoding="UTF-8"?>
<MTConnectDevices xmlns="urn:mtconnect.org:MTConnectDevices:2.3">
  <Header creationTime="2026-09-01T00:00:00Z" sender="cell3-pi" instanceId="1"
          version="2.3" bufferSize="131072" assetBufferSize="1024" assetCount="0"/>
  <Devices>
    <Device id="dmu1" name="DMU50-Cell3" uuid="shop-dmu50-cell3">
      <DataItems>
        <DataItem category="EVENT" id="dmu1_avail" name="avail" type="AVAILABILITY"/>
      </DataItems>
      <Components>
        <Controller id="dmu1_ctrl">
          <DataItems>
            <DataItem category="CONDITION" id="dmu1_system" name="system" type="SYSTEM"/>
          </DataItems>
          <Components>
            <Path id="dmu1_path">
              <DataItems>
                <DataItem category="EVENT" id="dmu1_exec" name="exec" type="EXECUTION"/>
                <DataItem category="EVENT" id="dmu1_parts" name="partcount" type="PART_COUNT"/>
              </DataItems>
            </Path>
          </Components>
        </Controller>
      </Components>
    </Device>
  </Devices>
</MTConnectDevices>
Pick a uuid once and never change it
Clients use the device uuid to know they're looking at the same machine across agent restarts and reconfigurations. Make it meaningful and permanent (shop-dmu50-cell3), not a random GUID you'll regenerate by accident.
Step 3: configure and run the agent
Use the reference agent, [cppagent](https://github.com/mtconnect/cppagent): open source (Apache 2.0), maintained by the MTConnect Institute, with pre-built Windows binaries on its releases page and Docker images on Docker Hub. The 2.x config is a small block-structured text file:
# agent.cfg
Devices = Devices.xml
Port = 5000
SchemaVersion = 2.3
BufferSize = 17          # 2^17 observations of history
MonitorConfigFiles = yes # reload when Devices.xml changes

Adapters {
  Cell3Pi {
    Device = DMU50-Cell3
    Host = 192.168.20.41   # the Raspberry Pi
    Port = 7878
  }
}
Run it with agent run agent.cfg from the folder holding both files (the executable name varies slightly between the Windows zip and Linux packages, so check the release notes for yours). The agent can live on the Pi itself, but I'd rather run one agent on a small server for the whole floor: one URL for every machine, one place to back up, and the Pi stays a dumb signal reader.
Step 4: prove it works
- 1Open `http://<agent>:5000/probe` in a browser. You should see your device model echoed back. If not, the agent didn't parse Devices.xml; check its log.
- 2Open `/current`. Before the adapter connects, everything is
UNAVAILABLE. That's correct, not a bug. - 3Start the adapter and refresh.
Availabilityflips toAVAILABLEandExecutionshows the lamp state. - 4Press cycle start on the machine and watch
/sample?interval=1000stream the change. - 5Pull the Pi's network cable. Within the heartbeat timeout, the agent should mark the device UNAVAILABLE. If it doesn't, your PONG handling is wrong, and you'd have been logging a frozen state as truth.
Once /current looks right, any MTConnect client can read it. Here's the same polling snippet I use against modern machines, which now works unchanged against the old one:
The gotchas that cost me the most time
- Time sync. SHDR timestamps come from the adapter. A Pi without a real-time clock that boots without network will happily stamp 1970. Enable NTP and check
timedatectlbefore you trust a single duration. - Mapping drift. Someone changes a PLC parameter and the amber light now means something different. Keep the mapping table in the adapter's repo, next to the code that implements it.
- The light is not the control. "Green" means the PLC turned on the green lamp. On most machines that's cycle-in-progress, but a dry run or a warm-up program looks exactly like production. If that matters, add a part-count pulse; it's the only signal that proves a part was made.
- Counting on the wrong edge. Count rising edges of the part-count pulse, not "is it on," or a slow relay counts one part three times.
- Don't overreach. You can't get feedrate, program name, or alarm text from a lamp. Declare only what you measure. An honest
UNAVAILABLEbeats a fabricated number.
The oldest machine on the floor doesn't need a new control to join the network. It needs someone willing to read its stack light carefully.
Next step: if your legacy machine does have a FANUC control with Ethernet, you can skip the lamp wiring entirely and read the control directly. That's building a FANUC → MTConnect bridge in Python. And once a few machines are streaming, put them on a live Grafana dashboard and compute OEE from real run states instead of guesses.