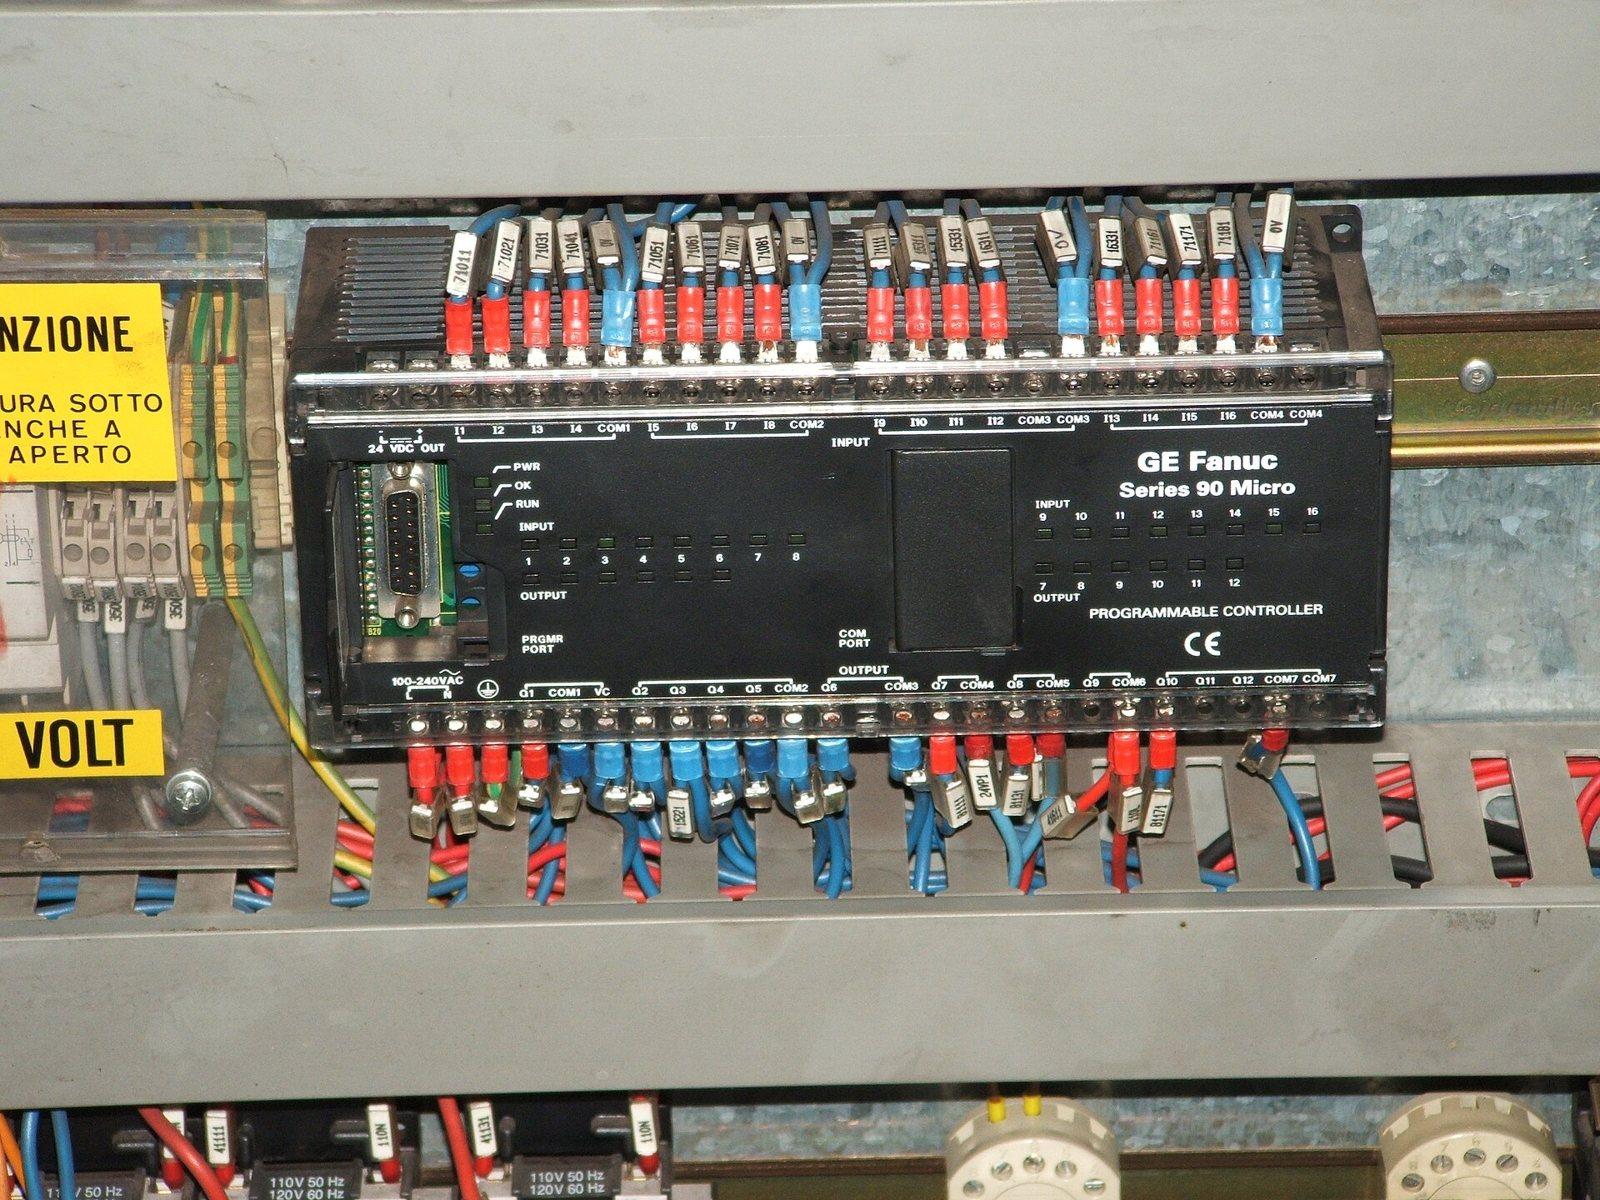
Here's the situation in most mixed shops: the new machines ship with MTConnect, and the FANUC-controlled ones from the last two decades don't, but they do have Ethernet and FOCAS. You could make your dashboard speak both. Or you could make the FANUCs speak MTConnect, and keep every downstream system (dashboards, OEE, the MCP server) talking to exactly one standard. That's what a bridge (MTConnect calls it an adapter) does.
This post builds one in Python. It assumes two things you may already have: an MTConnect agent running (set up in the legacy-CNC agent post), and FOCAS reads working against your control (covered in reading FANUC machine data with FOCAS and Python). The bridge is the glue: poll FOCAS, translate, publish SHDR.
Before you build: existing options
You don't always need to write this. The MTConnect Institute's adapter repository includes a C++ FANUC adapter, and the Ladder99 fanuc-driver is a configurable FOCAS collector that can serve SHDR to an agent. Commercial OPC/MTConnect gateways exist too. Writing your own makes sense when you want full control of the mapping, need custom data (macro variables, PMC signals), or want something small enough to read in one sitting.
The real work is the mapping
Reading FOCAS is mechanical. The decisions are in translating FANUC's codes into MTConnect's vocabulary so that "running" means the same thing on every machine. On 0i-D/F and 30i-series controls, cnc_statinfo returns an ODBST struct whose run, aut, emergency, and alarm fields carry most of what you need:
| FOCAS field | FANUC value | MTConnect data item | MTConnect value |
|---|---|---|---|
run | 3 STRT (cycle running) | Execution | ACTIVE |
run | 2 HOLD (feed hold) | Execution | FEED_HOLD |
run | 1 STOP (auto operation stopped) | Execution | STOPPED |
run | 0 reset / idle | Execution | READY |
aut | 1 MEM, 10 RMT | ControllerMode | AUTOMATIC |
aut | 0 MDI | ControllerMode | MANUAL_DATA_INPUT |
aut | 3 EDIT | ControllerMode | EDIT |
aut | 4 HND, 5 JOG, 8 INC, 9 REF | ControllerMode | MANUAL |
emergency | 1 EMG | EmergencyStop | TRIGGERED (else ARMED) |
alarm | 1 alarm present | Condition (SYSTEM) | FAULT + alarm text from cnc_rdalmmsg2 |
Write that table down and get the people who'll read the dashboard to agree with it before you code. Is M00 "stopped" or "interrupted"? Is a machine in MDI running a warm-up "available"? Those are business decisions, and if they're buried in code they'll be argued about later in front of a red bar on a TV.
Step 1: the FOCAS side
Calling Fwlib32.dll through ctypes means declaring the structs yourself. One trap first: `Fwlib32.dll` is a 32-bit DLL and needs 32-bit Python. On 64-bit Python, use FANUC's Fwlib64.dll if your FOCAS package includes it, or a pure-Python protocol implementation like pyfanuc, which also runs on Linux.
# focas.py - minimal FOCAS reads for the bridge (0i-D/F, 30i-series struct layouts)
import ctypes as C

fw = C.WinDLL("Fwlib32.dll")

class ODBST(C.Structure):
    _fields_ = [(n, C.c_short) for n in
                ("hdck", "tmmode", "aut", "run", "motion", "mstb", "emergency", "alarm", "edit")]

class ODBACT(C.Structure):                 # cnc_actf / cnc_acts
    _fields_ = [("dummy", C.c_short * 2), ("data", C.c_long)]

class ODBPRO(C.Structure):                 # cnc_rdprgnum
    _fields_ = [("dummy", C.c_short * 2), ("data", C.c_long), ("mdata", C.c_long)]

class ODBM(C.Structure):                   # cnc_rdmacro
    _fields_ = [("datano", C.c_short), ("dummy", C.c_short),
                ("mcr_val", C.c_long), ("dec_val", C.c_short)]

class ODBALMMSG2(C.Structure):             # cnc_rdalmmsg2
    _fields_ = [("alm_no", C.c_long), ("type", C.c_short), ("axis", C.c_short),
                ("dummy", C.c_short), ("msg_len", C.c_short), ("alm_msg", C.c_char * 64)]

class FocasError(Exception):
    pass

def ok(ret, what):
    if ret != 0:
        raise FocasError(f"{what} returned {ret}")

class Fanuc:
    def __init__(self, ip, port=8193, timeout=5):
        self.h = C.c_ushort()
        ok(fw.cnc_allclibhndl3(ip.encode(), port, timeout, C.byref(self.h)), "connect")

    def close(self):
        fw.cnc_freelibhndl(self.h)

    def status(self):
        st = ODBST()
        ok(fw.cnc_statinfo(self.h, C.byref(st)), "cnc_statinfo")
        return st

    def feed_rpm(self):
        f, s = ODBACT(), ODBACT()
        ok(fw.cnc_actf(self.h, C.byref(f)), "cnc_actf")
        ok(fw.cnc_acts(self.h, C.byref(s)), "cnc_acts")
        return f.data, s.data                     # feed in mm/min (metric), rpm

    def program(self):
        p = ODBPRO()
        ok(fw.cnc_rdprgnum(self.h, C.byref(p)), "cnc_rdprgnum")
        return f"O{p.data:04d}"

    def macro(self, number):
        m = ODBM()
        ok(fw.cnc_rdmacro(self.h, number, 10, C.byref(m)), "cnc_rdmacro")
        return m.mcr_val / 10 ** m.dec_val

    def alarms(self, max_n=10):
        n = C.c_short(max_n)
        buf = (ODBALMMSG2 * max_n)()
        ok(fw.cnc_rdalmmsg2(self.h, -1, C.byref(n), buf), "cnc_rdalmmsg2")
        return [(buf[i].alm_no, buf[i].alm_msg[: buf[i].msg_len].decode(errors="replace").strip())
                for i in range(n.value)]
Step 2: translate and publish
The bridge loop polls a few times a second, maps values through the table above, and sends only what changed, exactly like the stack-light adapter. The SHDR server is the same tiny socket server, so it's factored into a class here:
# fanuc_bridge.py
import socket, threading, time
from datetime import datetime, timezone
from focas import Fanuc, FocasError

EXECUTION = {0: "READY", 1: "STOPPED", 2: "FEED_HOLD", 3: "ACTIVE", 4: "ACTIVE"}
MODE = {0: "MANUAL_DATA_INPUT", 1: "AUTOMATIC", 3: "EDIT", 10: "AUTOMATIC"}   # else MANUAL

def ts():
    return datetime.now(timezone.utc).isoformat(timespec="milliseconds").replace("+00:00", "Z")

class ShdrServer:
    def __init__(self, port=7878):
        self.clients, self.lock, self.snapshot = [], threading.Lock(), {}
        self.srv = socket.create_server(("0.0.0.0", port))
        threading.Thread(target=self._accept, daemon=True).start()

    def _accept(self):
        while True:
            conn, _ = self.srv.accept()
            with self.lock:
                self.clients.append(conn)
            self._send(ts() + "".join(f"|{k}|{v}" for k, v in self.snapshot.items()), conn)
            threading.Thread(target=self._pong, args=(conn,), daemon=True).start()

    def _pong(self, conn):
        for line in conn.makefile():
            if line.startswith("* PING"):
                self._send("* PONG 10000", conn)

    def _send(self, line, only=None):
        with self.lock:
            for c in ([only] if only else list(self.clients)):
                try:
                    c.sendall((line + "\n").encode())
                except OSError:
                    if c in self.clients:
                        self.clients.remove(c)

    def update(self, values):
        changed = {k: v for k, v in values.items() if self.snapshot.get(k) != v}
        if changed:
            self.snapshot.update(changed)
            self._send(ts() + "".join(f"|{k}|{v}" for k, v in changed.items()))

    def condition(self, lines):
        for line in lines:                       # each condition on its own line
            self._send(f"{ts()}|{line}")

def read_all(cnc):
    st = cnc.status()
    feed, rpm = cnc.feed_rpm()
    return {
        "avail": "AVAILABLE",
        "exec": EXECUTION.get(st.run, "READY"),
        "mode": MODE.get(st.aut, "MANUAL"),
        "estop": "TRIGGERED" if st.emergency == 1 else "ARMED",
        "program": cnc.program(),
        "path_feed": round(feed / 60.0, 2),     # MTConnect PathFeedrate is mm/SECOND
        "S1speed": rpm,
        "partcount": int(cnc.macro(3901)),
    }, (cnc.alarms() if st.alarm else [])

shdr, cnc, last_alarms = ShdrServer(), None, None
while True:
    try:
        cnc = cnc or Fanuc("192.168.20.30")
        values, alarms = read_all(cnc)
        shdr.update(values)
        if alarms != last_alarms:
            lines = ["system|NORMAL||||"]       # clear, then re-assert active alarms
            lines += [f"system|FAULT|{no}|||{msg}" for no, msg in alarms]
            shdr.condition(lines)
            last_alarms = alarms
    except (FocasError, OSError):
        if cnc:
            cnc.close()
        cnc, last_alarms = None, None
        shdr.update({"avail": "UNAVAILABLE"})     # tell the truth when the link drops
        time.sleep(5)
    time.sleep(0.5)
Units: the bug nobody notices for months
FOCAS reports actual feed in the control's units, typically mm/min on a metric machine. MTConnect's PathFeedrate is defined in mm/second. Forget to divide by 60 and every feedrate on your dashboard is 60× too high, and plausible enough that nobody questions it. Check every numeric data item's MTConnect units against what the control actually returns.
Step 3: the device model
Extend the Devices.xml from the agent post with the extra data items. The names must match what the bridge sends:
<Device id="f1" name="Robodrill-1" uuid="shop-robodrill-1">
  <DataItems>
    <DataItem category="EVENT" id="f1_avail" name="avail" type="AVAILABILITY"/>
    <DataItem category="EVENT" id="f1_estop" name="estop" type="EMERGENCY_STOP"/>
  </DataItems>
  <Components>
    <Axes id="f1_axes">
      <Components>
        <Rotary id="f1_s1" name="S1">
          <DataItems>
            <DataItem category="SAMPLE" id="f1_s1rpm" name="S1speed" type="ROTARY_VELOCITY"
                      subType="ACTUAL" units="REVOLUTION/MINUTE"/>
          </DataItems>
        </Rotary>
      </Components>
    </Axes>
    <Controller id="f1_ctrl">
      <DataItems>
        <DataItem category="EVENT" id="f1_mode" name="mode" type="CONTROLLER_MODE"/>
        <DataItem category="CONDITION" id="f1_system" name="system" type="SYSTEM"/>
      </DataItems>
      <Components>
        <Path id="f1_path">
          <DataItems>
            <DataItem category="EVENT" id="f1_exec" name="exec" type="EXECUTION"/>
            <DataItem category="EVENT" id="f1_prog" name="program" type="PROGRAM"/>
            <DataItem category="EVENT" id="f1_parts" name="partcount" type="PART_COUNT"/>
            <DataItem category="SAMPLE" id="f1_feed" name="path_feed" type="PATH_FEEDRATE"
                      subType="ACTUAL" units="MILLIMETER/SECOND"/>
          </DataItems>
        </Path>
      </Components>
    </Controller>
  </Components>
</Device>
Running it like infrastructure, not a script
- Keep one connection open. Controls accept only a limited number of simultaneous FOCAS connections, and other software (the builder's monitoring, a tool presetter link) may already use some. Open one handle per machine, reuse it, and reconnect only on error, as the loop above does.
- Don't poll too fast. Two to five polls per second is plenty for state; FOCAS calls run alongside the control's own work, and machine monitoring should never be noticeable to the machine.
- Run it as a service. On Windows, NSSM or a scheduled task at startup; on Linux (with pyfanuc), a systemd unit with
Restart=always. A bridge that dies silently at 2am is just a delayed outage. - Log the raw values alongside the mapping. When someone questions a red bar, the raw
run/autcodes are how you settle it. - Read-only, always. FOCAS can write parameters and offsets. This bridge never should. Keep write functions out of the code entirely.
A bridge is a translation, and translations are opinions. Write the mapping table down, agree on it, and only then write the code.
With the bridge running, a FANUC machine is indistinguishable from a native MTConnect machine to everything downstream: it shows up on the Grafana dashboard, feeds OEE, and answers questions through an MCP server. For controls that aren't FANUC, the controller-by-controller guide lists the equivalent read path for each, and the same bridge pattern applies.